NHS Activity Tracker: June
Acute sector
2.46m
A&E attendances – the busiest month on record
1.95m
waiting for diagnostic testing – the highest figure on record
1.8m
new cases added to the elective waiting list – the busiest April on record
Accident & Emergency (A&E) (data for May 2026)
A&E attendances
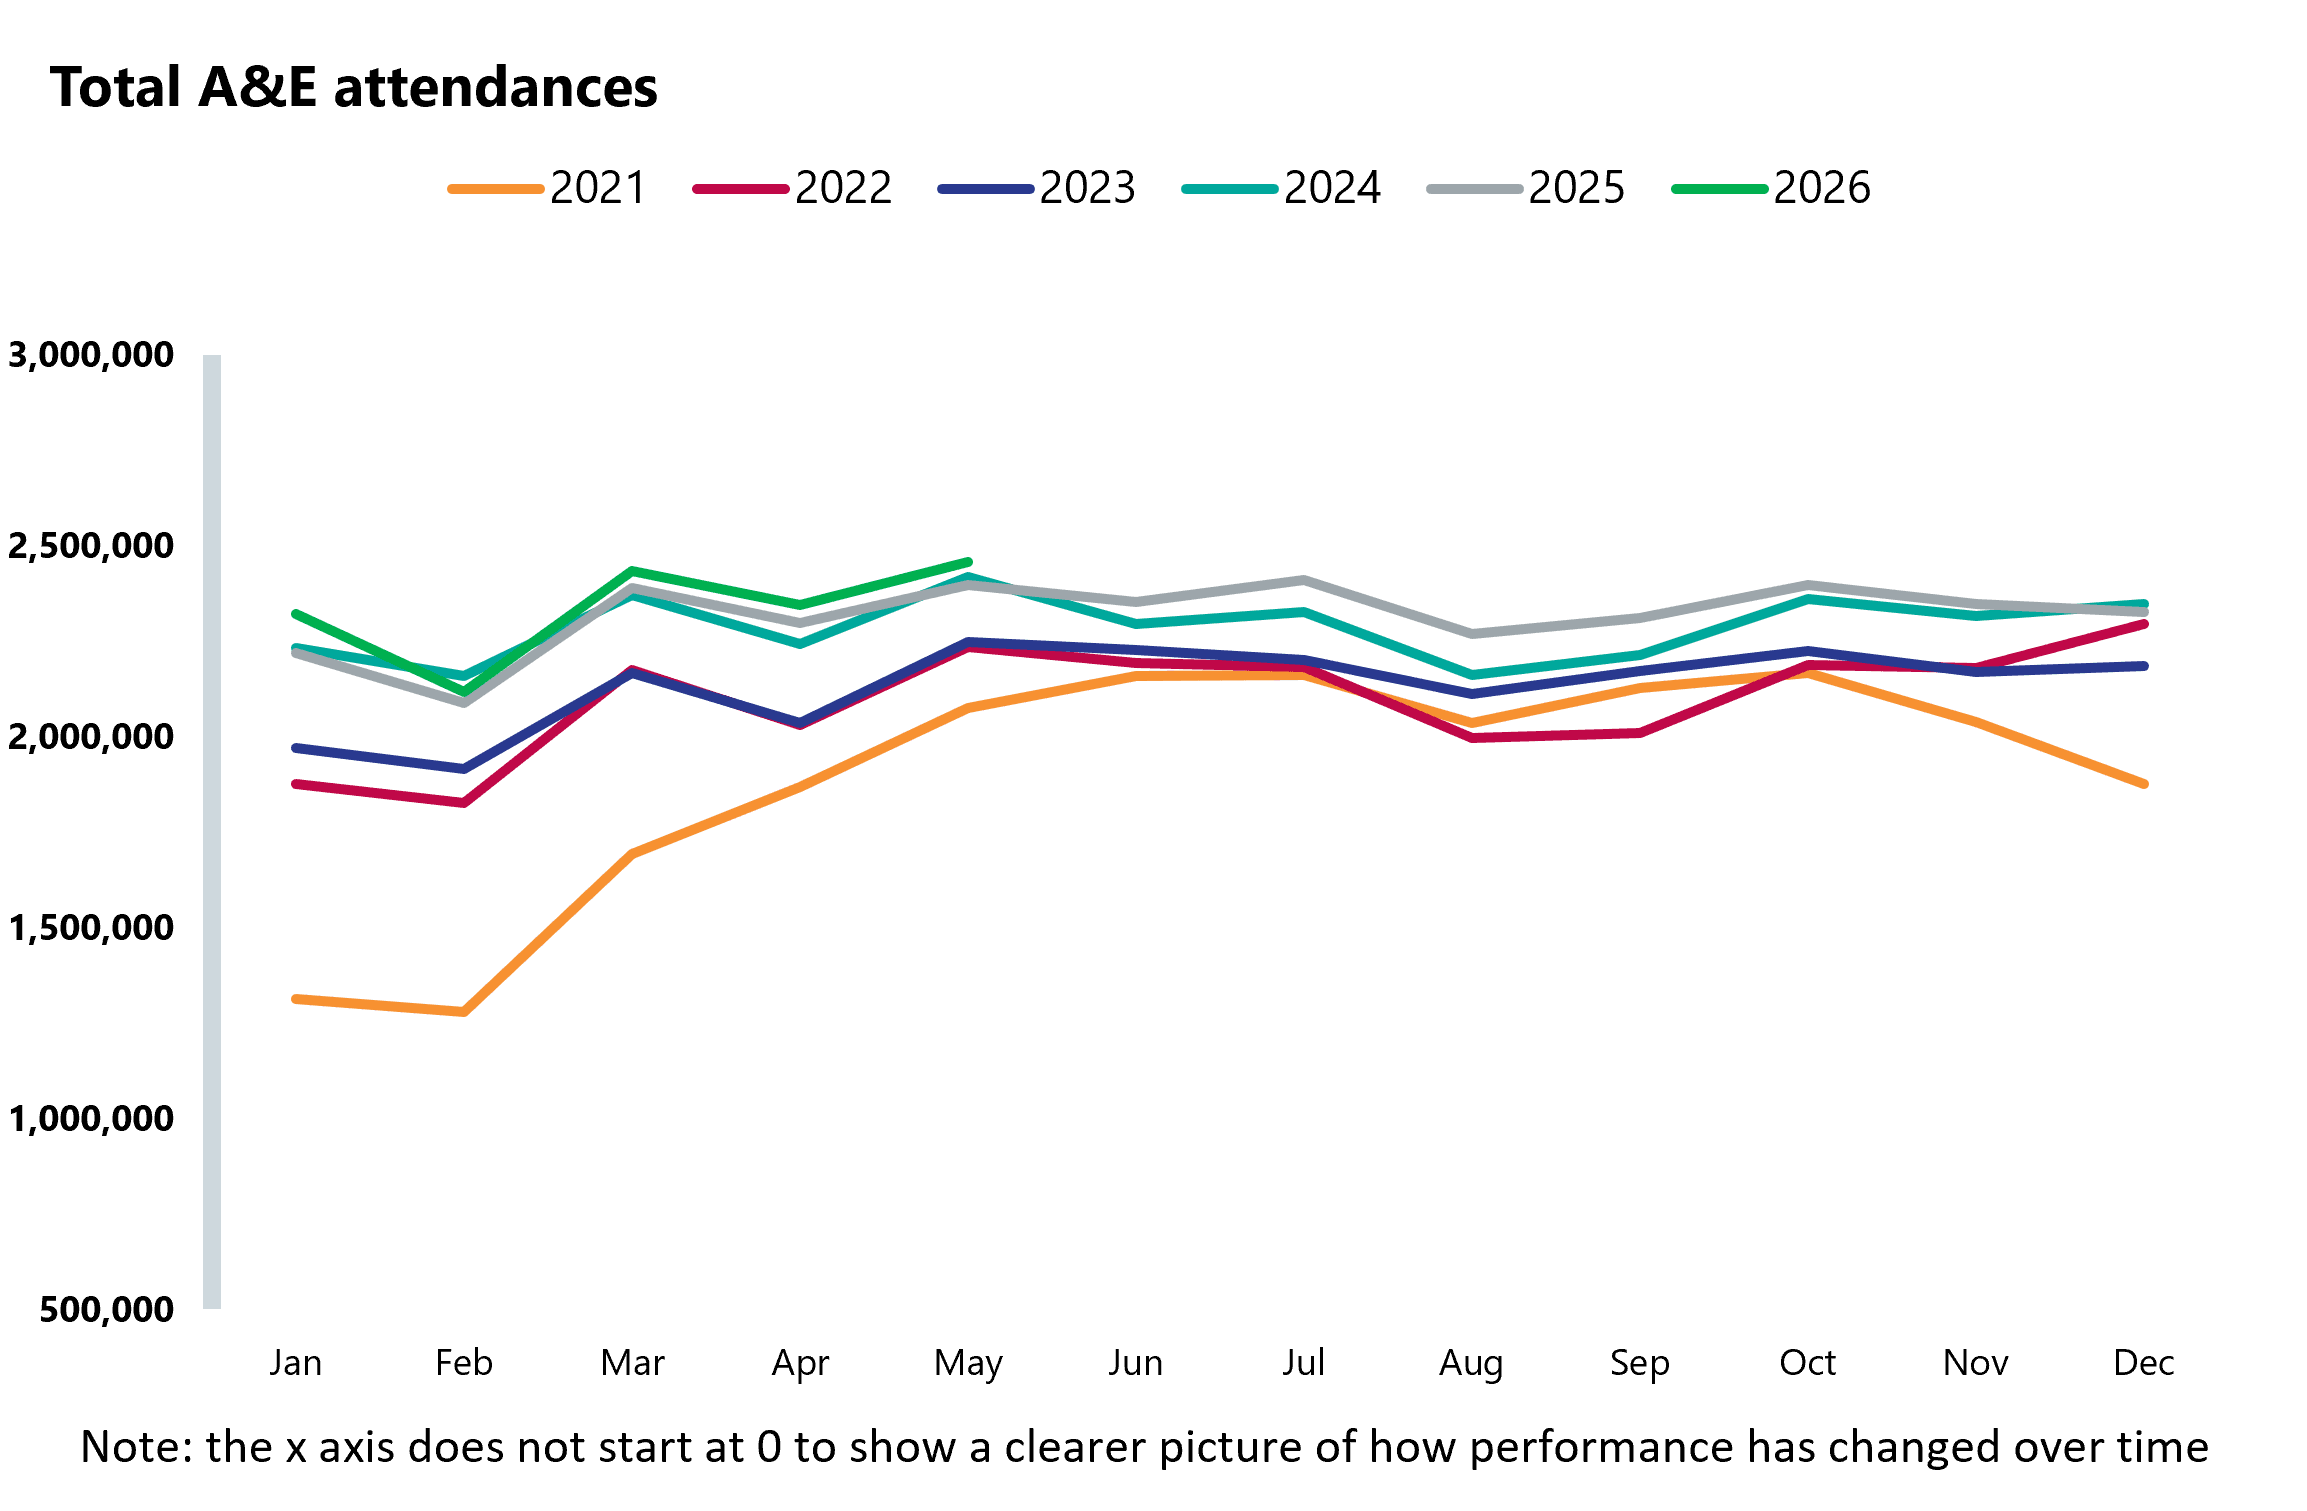
- There were 2.46 million A&E attendances this month, compared with 2.35 million in April. This value stood at 2.40 million in May 2025. This is the busiest month on record and is shown in Figure 1.
- 75.7% of patients were seen within four hours, compared with 76.9% in April. This remains below the 78% aim set for the month in the 2025/26 planning guidance.
- New, experimental data on performance in type 1 and 2 A&E departments shows that 62.5% of patients were admitted, transferred or discharged within four hours, which is notably lower than the overall four-hour performance.
Figure 1
A&E emergency admissions
- There were 533,280 emergency admissions in total, compared with 545,128 in May 2025.
12-hour waits in A&E from decision to admit to admission
- 50,212 patients waited at least 12 hours from the decision to admit to admission, compared with 42,891 in May 2025.
12 hours in an emergency department (ED) from arrival
- 147,957 patients waited more than 12 hours from arrival at a type 1 & 2 A&E in May, compared with 139,881 in May 2025.
- Waits of over 12 hours in A&E occurred 9.7% of the time, meeting the 10% aim outlined in the UEC delivery plan published in June.
Acute discharge delays (data for May 2026)
- On average, 60.1% of patients who no longer met the criteria to reside remained in hospital per day, compared with 56.7% for May 2025.
Cancer (data for April 2026)
- 75.9% of patients were told they have cancer, or cancer was definitively excluded within 28 days of urgent referral (FDS) compared with 76.7% in April 2025. The target set out in the Medium Term Planning Framework was for this to be maintained at 80%.
- 91.5% of patients waited less than a month from a decision to treat to first treatment (31-day target) compared with 91.3% in April 2025. The operational standard is for this to be 96%.
- 70.0% of patients waited less than two months from an urgent suspected cancer referral to a first definitive treatment (62-day target), compared with 70.1% in April 2025. The target set out in the Medium Term Planning Framework was for this to be maintained at 85%.
Diagnostics (data for April 2026)
- 2.5 million diagnostic tests and procedures were carried out this month, compared with 2.42 million in April 2025.
- The waiting list reached 1.95 million, the highest figure since records began in January 2006. The waiting list was 1.70 million in April 2025, and 1.05 million in April 2019, indicating sustained strain on diagnostic services since the pandemic.
- 24.9% of patients have been on an NHS waiting list for diagnostic tests for 6 weeks or more at the end of April, compared with 21.3% in April 2025.
Elective waiting list (data for April 2026)
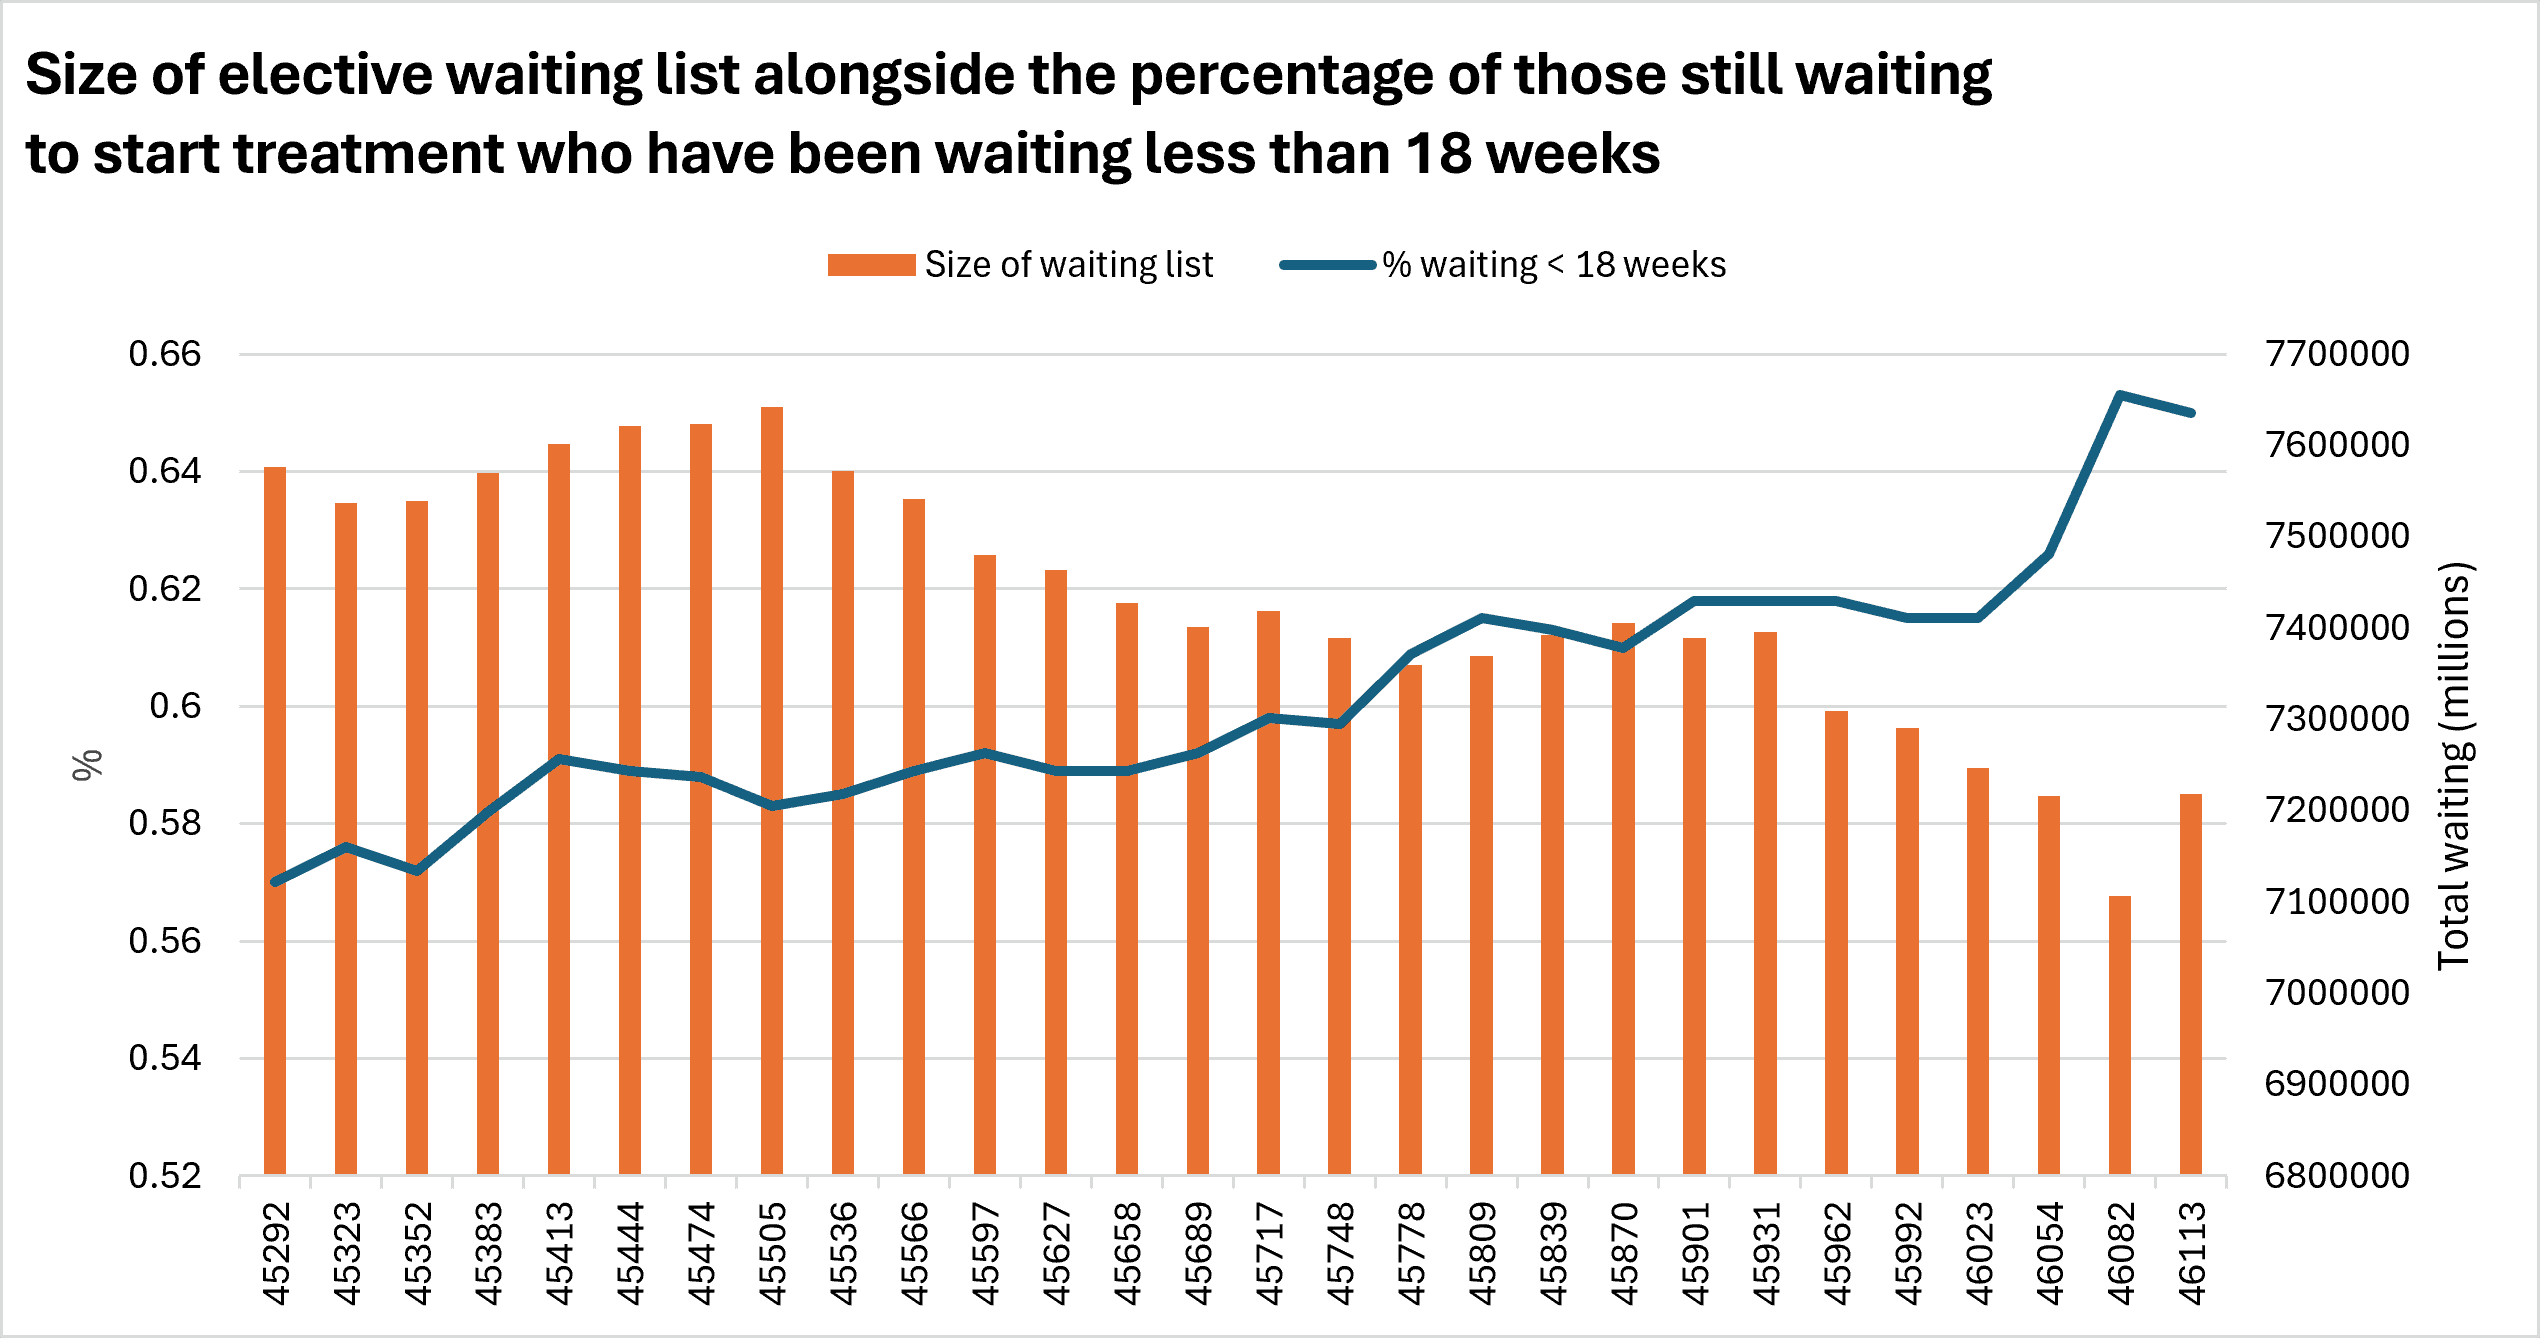
- The size of the waiting list increased to 7.22 million in April, compared with 7.11 million in March. This is notably lower than the 7.39 million in April 2025, but the list remains significantly higher than before the pandemic (4.41 million in April 2019). The progress seen on reducing the elective waiting list since January 2024 is shown in Figure 2.
- 4.6% of patients on the waiting list were unique patients. This is an estimated 6.11 million people.
- The number of cases waiting more than 18 weeks was 2.53 million, compared with 2.98 in April 2025.
- Waits within 18 weeks were equivalent to 65.0% of the total, compared with 59.7% in April 2025. This therefore means that the planning guidance aim for 65% of treatments to be waiting no longer than 18 weeks by March 2026 was met this month. The progress seen on improving the proportion of patients waiting more than 18 weeks is shown in Figure 2.
- Waits of over 52 weeks (99,781) have fallen from 190,023 in April 2025 and now account for 1.4% of all waits. The planning guidance sets out an aim for waits over a year to account for 1% of all waits by this month, which was not met.
- 1.48 million cases were managed on the waiting list this month.
- Demand for elective care, measured by new cases added to the list (1.80 million cases) continued to outpace activity. This is the largest number of new cases added in an April on record.
Figure 2